An earthquake in a populated area can kill hundreds of people, make thousands homeless, and cause billions of dollars of property damage. Even an earthquake in a completely unpopulated underwater area can cause immensely destructive tsunamis. Many of the major population centers of the world lie directly on major tectonic faults (Los Angeles, Mexico City, and Tokyo for example) and any port city could be drowned by a tsunami so researchers all over the world are working on predicting earthquakes and mitigating their effects. Earthquake prevention does not seem possible.
"Four kinds of geologic data are most useful for predicting potential tectonic activity: subsurface ruptures along fault zones, stratigraphic sequences related to tectonic activity, landforms related to surface rupture and regional uplift or subsidence, and relationships between seismicity and tectonic features." (Callendar 124)Yet even with this knowledge and the immense amount of data already gathered, Callendar says efforts to predict earthquakes "have met with little success." (137)
Solid-state physicist Panayiotis Varotsos of the University of Athens has studied the electric properties of squeezed dry rocks just before they fracture. Assuming that earthquakes are larger varieties of fractures, Varotsos, Alexopoulos, and Nomicos use their own V.A.N. method of detecting seismic electric signals to predict earthquakes. They have had a success rate of 65 to 70% for their predictions but electrical geophysicist Stephen Park of the University of California at Riverdale says, "Varotsos has only issued predictions for 10% of the earthquakes that have actually occurred." And even the correct predictions have only been timed within several weeks and located within 100 k.(Kerr 911)
Perhaps the main problem with earthquake prediction is that the faults display fractal geometry and the final buildup and release of stress "are fast and strongly non-linear" processes. (Meissner 161) Even "the most universal formula in seismology," (Diao et al 205), the Gutenberg-Richter Law relating magnitude, energy, and frequency, is a classic fractal of dimension 1.8 to 2. (Turcotte 7) Of course, fractals weren't quantified and explained by Mandelbrot until 30 years after Gutenberg and Richter codified their law in 1954.
An easy way to think of a fractional dimension is to picture a line on a sheet of paper. The sheet of paper represents two-dimensional space. Any normal line drawn on it would be one-dimensional. But now consider someone like my three-year-old daughter Karen getting very excited and scribbling a line all over the paper. If the line completely covered the paper, then you could say it turned into a two-dimensional line and sometime during the scribbling it was a one-and-a-half dimensional line. Sufficiently complex lines can have dimensions greater than one.
A more rigorous and classic development of fractals uses an example from marine geology coastlines. Mandelbrot's book even has a chapter titled "How Long Is the Coast of Britain?" (25) The main problem with measuring a coastline is that no matter what base unit of measure you use, you can always use a smaller one to get a longer length. Mapping the east coast of America using a scale of 100 miles per inch (since we're in America) will display some of the larger bays and peninsulas such as Chesapeake Bay and Cape Cod but will ignore smaller ones. Dropping down an order of magnitude and drawing a map at a scale of ten miles per inch will meander around many of the smaller bays and protrusions missed in the larger mapping. This would make the total length of the coast quite a bit longer. Dropping another order of magnitude to one mile per inch, then to one-tenth mile and so on will keep locating smaller and smaller bays, coves, and inlets, each of which increase the total length of the coastline. This keeps happening down to tiny scales such as measuring the water where it winds in and out around individual rocks, pebbles and grains of sand.
Mathematicians have used many methods to measure lengths of naturally convoluted shorelines but "all measurement methods ultimately lead to the conclusion that the typical coastline's length is very large and so ill-determined that it is best considered infinite." (Mandelbrot 25) In real life, L.F. Richardson in Statistics of Deadly Quarrels found "notable differences in the lengths of common land frontiers claimed by Spain and Portugal (987 versus 1214 km)." (Mandelbrot 33) The length of everyday, non-Euclidean objects depends on the length of the measuring stick. Benoit Mandelbrot decided to try to quantify this dependence and discovered the Hausdorff-Besicovitch idea of dimension which is able to distinguish between highly convoluted coastlines and less-convoluted ones made of cliffs and sea walls. This dimension measurement is independent of the length of the measuring stick and is much better than topology which "fails to discriminate between different coastlines." (Mandelbrot 17)
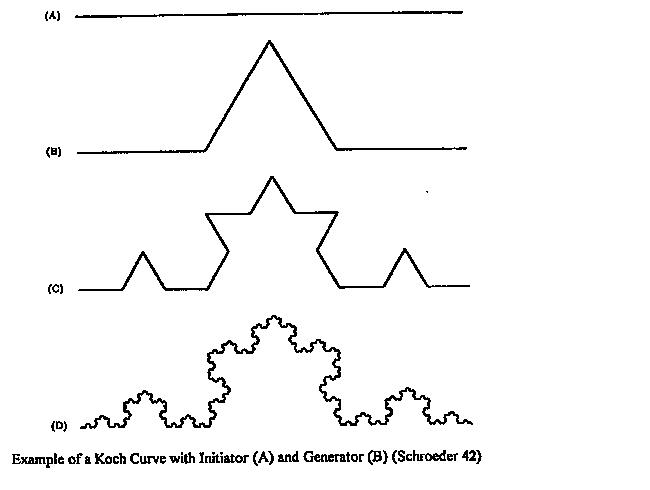
To better study these types of curves, Mandelbrot began creating and studying other mathematical "curves." These usually consist of a basic section or polygon and then a "generator" which replaces each section of the curve. The classic Koch Island begins with a triangle and replaces each side with a new side that is 4/3 the length of the original side.
Each smaller section is then replaced with another triangular segment. At each iteration, the total length of the curve gets 1/3 longer than before (and the dimension is log4/log3 ÷1.2618). Thus any measurement using a smaller stick will always find a larger length and the true mathematical length is infinite because the mathematical iteration can be carried out infinitely many times. Despite some reservations about using these curves to study reality, they have turned out to be useful and Mandelbrot turns the arguments around by saying the "monster" Koch curve's "irregularity is far too systematic" and can only be suggestive of a real coastline's convolutions. (35)
Between certain levels of magnitude, mathematicians often use the similarity dimension to guess the Hausdorff dimension. (Mandelbrot 37) A piece of a coastline such as a small cove and outcropping is similar to a large bay and peninsula and to an indentation and projection of the edge of a single rock. Of course, "below the lower limit, the concept of coastline ceases to belong to geography." (Mandelbrot 38) However, Hausdorff showed how his dimension is useful in mathematics and Mandelbrot claims it is "vital in the natural sciences." (44)
Earthquake researchers have found fractals in three different ways:
These simple stick-slip models were modified by later researchers to include various options such as:
Turcotte's first cellular automata model resembled seismicity in a zone of crustal deformation but didn't generate any characteristic earthquakes or fore- and after-shocks. (11) The revised model allowing instabilities to affect other cells not only created after-shocks, but 31% of the largest events had fore-shocks a good correlation with reality. (12)
However, "even the most refined slider-block models are only poor replicae of natural processes." (Meissner 160) Other methods have been developed to find the fractal dimension of active faults, of ruptures in experimental rocks, of drainage systems and dimensions related to "crustal deformation, electrical resistivity, and groundwater, where variations are concerned with earthquakes." (Diao et al 199) And it has been accepted that individual faults have individual earthquakes and that the distribution of faults and of earthquakes are each fractal, but are not necessarily the same dimension. (Turcotte 7)
Fractal curves can be constructed to model chaotic processes. These curves allow discovery of the dimension of the process. In addition, with a curve associated with a "weakly chaotic system, a limited prediction might be possible" (Meissner 159) in exactly the same way an algebraic curve of a normal calculus function is used for prediction. But a fractal curve cannot be used for exact prediction due to its inherently chaotic, non-differentiable nature (which implies fractals are perfectly suited for the study of chaos).
The slow grinding of tectonic plates produces pressure which is released in non-linear ways. Even the spring-block models lead to "examples of deterministic chaos." (Turcotte 16) Others say, "The fractal dimension of an active fault system is probably related to the stress character." (Diao et al 203) And in the final stage of stress accumulation, micro cracks coalesce into large cracks which fill with liquids. "Both processes are fast and strongly non-linear." (Meissner 161) Rolf Meissner also offers a couple other arguments for the non-linearity of earthquakes the lack of a tidal cause and the loading of stress by plate creep. (163)
This stress has been thought by many to cause the entire crust of the earth to get in a state of self-organized criticality where any change makes unpredictable changes in other areas such as in a game of Pick Up Sticks.(Turcotte 9) One piece of evidence is the fact that the filling of large dams always induces seismicity. But there are no equations and while researchers have tried calculating various fractal characteristics and have found some chaotic attractors for certain earthquake regions in China, none "are sure whether earthquakes are chaotic." (Diao et al 207)
Using a very simple fractal analysis of the Los Angeles area, S. E. Hough found it reasonable to assume one M 7.4 to 7.5 earthquake every 245-325 years and six events in the M 6.6 range, less than what has occurred in the historic record. (213) Rolf Meissner says, "The magnitude seems to be the most elusive parameter [to predict] because of the additional non-linearity of the rupture process itself which apparently can hardly be modeled by the slider-block models." (164) John Callendar says, "The most significant problem with earthquake prediction is probably the lack of acceptable models that explain why precursors work." (137)
There are probably other problems of which we are currently unaware. Yet until we understand earthquakes better, we'll have little chance of ever "predicting their fickle outbursts." (Anderson 190) The mathematical technique of fractals is one of the best approaches for studying non-linear, chaotic kinds of problems and will continue to be heavily used in earthquake research. Perhaps Donald Turcotte sums it up best. "The earth's crust resembles a thermodynamic system near a critical point. The fluctuations are earthquakes." (19)